Sources: Farmer IDs as on 6 August 2026 and DCS plots from
Lok Sabha Unstarred Question 3879; 19 March 2026 figures from
PIB release of 24 March 2026. "Not listed" means the state does not
appear in that official table. Data last verified 12 October 2026.
Digital Crop Survey plots by state (Rabi 2025-26)
Plots covered by the Digital Crop Survey, Rabi 2025-26 (Lok Sabha Unstarred Question 3879)
Notes on the official data
In Lok Sabha Question 2753 (data as on 30 July 2026) the state annexure lists Uttar Pradesh at 2,46,28,676 Farmer IDs while the district annexure for Uttar Pradesh adds up to 2,46,48,335. Both figures are reproduced exactly as published; the difference (19,659) exists in the source document.
In Lok Sabha Question 3879, the 21 state rows of the Rabi 2025-26 Digital Crop Survey annexure add up to 30,62,01,769 plots, while the printed total is 31,40,04,270 (difference 78,02,501). The answer text says 'more than 31.3 crore plots'. The state rows are reproduced exactly; the gap may reflect states or UTs not listed in the annexure.
Figures are cumulative counts of Farmer IDs generated. They are not the number of farmers in a state and not a measure of registration completeness.
Digital Crop Survey figures count surveyed plots (land parcels), not farmers.
What this page shows
The dashboard above brings together every official AgriStack figure we could verify, each with its reporting date and a link to the Government document it comes from. We do not estimate, project or fill gaps. If a figure is not in an official source, it is not on this page.
All figures were transcribed from:
Lok Sabha replies by the Ministry of Agriculture and Farmers Welfare, which include state-wise tables (annexures), and
Press Information Bureau (PIB) releases summarising those replies.
We last checked all sources on 12 October 2026. The most recent official state-wise table we found refers to 6 August 2026.
How to read the numbers
Indian numbering is used throughout: 1 lakh = 1,00,000 and 1 crore = 1,00,00,000. So 10,33,93,603 is about 10.34 crore, or roughly 103 million.
Key findings in plain words
1. More than 10.33 crore Farmer IDs by August 2026
As on 6 August 2026, 10,33,93,603 Farmer IDs had been generated across 21 states and union territories. That is an increase of 1,15,23,918 since the 19 March 2026 table, which totalled 9,18,69,685.
The national count passed several milestones during 2026:
Date the figure refers to
Farmer IDs
Where it was published
4 February 2026
more than 8.48 crore
PIB, 10 February 2026 (text only)
19 March 2026
9,18,69,685
PIB, 24 March 2026 (state table)
30 July 2026
10,28,25,379
Lok Sabha reply, 4 August 2026
3 August 2026
more than 10.31 crore
PIB, 7 August 2026 (text only)
6 August 2026
10,33,93,603
Lok Sabha reply, 11 August 2026
2. Uttar Pradesh leads, and drove much of the growth
Uttar Pradesh had 2,47,59,182 Farmer IDs on 6 August 2026, close to a quarter (23.9%) of all IDs nationally. Between March and August its count rose by 47,83,531, which is about 41% of all the growth across India in that period.
The next largest were:
Rank
State
Farmer IDs (6 Aug 2026)
Share of national total
1
Uttar Pradesh
2,47,59,182
23.9%
2
Maharashtra
1,36,28,992
13.2%
3
Madhya Pradesh
1,14,44,193
11.1%
4
Rajasthan
87,46,218
8.5%
5
Karnataka
66,05,504
6.4%
6
Gujarat
62,46,923
6.0%
7
Bihar
55,50,075
5.4%
3. Fast percentage growth in states that started later
Some states with smaller counts grew quickly between March and August 2026:
Punjab went from 75,681 to 3,85,515, about five times its March figure.
Uttarakhand more than doubled, from 1,50,747 to 3,30,466.
Odisha grew by about 42%, from 14,70,707 to 20,87,004.
Bihar grew by about 18%, adding 8,55,677 IDs.
Sikkim (38,507) and Jammu and Kashmir (160) appear for the first time in the August table. PIB’s 7 August 2026 release also said Manipur “has initiated the process of DCS and participating in the process of creation of Farmer ID”.
Percentage growth from a small base can look dramatic. It mostly reflects when a state began, not how well it is doing compared with others.
4. Digital Crop Survey covered 648 districts in Rabi 2025-26
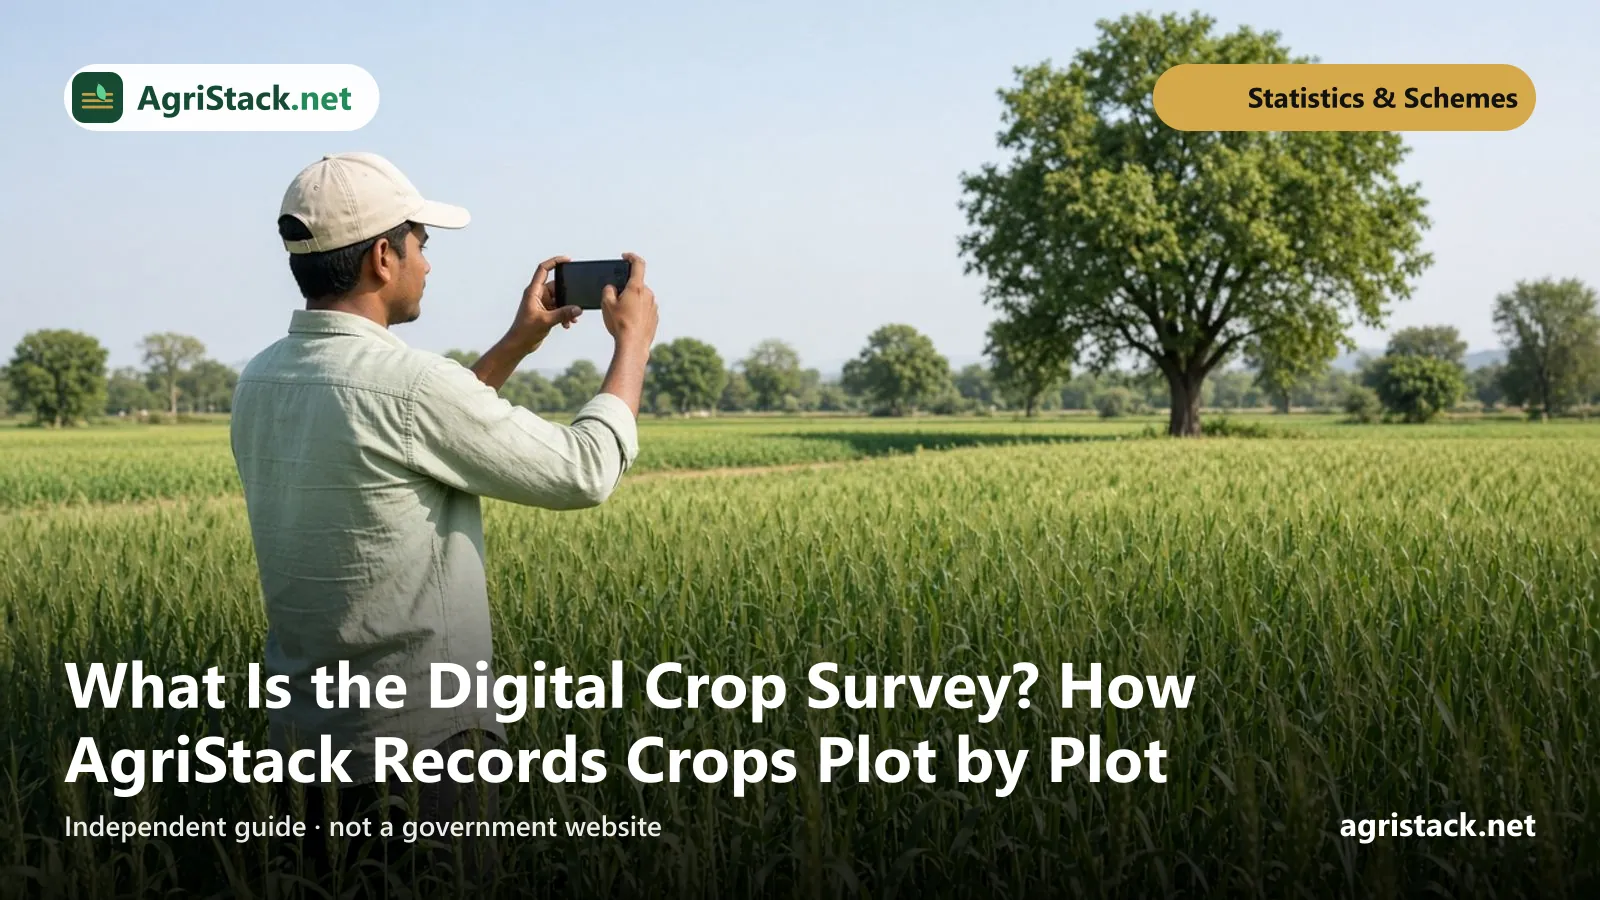
The Digital Crop Survey records which crop is grown on each plot, using geo-tagged photos. According to the Ministry:
Kharif 2025: 604 districts and more than 28.5 crore plots (PIB, 10 February 2026).
Rabi 2025-26: 648 districts and “more than 31.3 crore plots” (Lok Sabha, 11 August 2026).
In the Rabi 2025-26 state table, the largest numbers of plots surveyed were in Uttar Pradesh (5,56,88,914), Madhya Pradesh (4,81,34,982), Tamil Nadu (3,38,84,867), Odisha (3,01,09,994) and Rajasthan (2,72,66,008). Learn more in What is the Digital Crop Survey?
5. District-level data is available for Uttar Pradesh
The Lok Sabha reply of 4 August 2026 included Farmer IDs for all 75 districts of Uttar Pradesh as on 30 July 2026. The districts with the most IDs were Azamgarh (7,58,877), Sitapur (7,26,097), Jaunpur (7,05,897), Hardoi (6,86,929) and Kheri (6,26,190). The lowest were largely urban districts such as Gautam Buddha Nagar (45,708) and Ghaziabad (62,853).
You can search all 75 districts on our district and village guide. We have not found official district-wise tables for other states yet.
Inconsistencies we found in official documents
Official documents are not always internally consistent. Rather than silently “correcting” them, we show the figures as published and note the differences:
Document
What we noticed
What we show
PIB, 24 March 2026
Headline says “more than 9.20 crore”; the table in the same release adds up to 9,18,69,685
The table total, with a note
Lok Sabha 3879, Annexure II (DCS Rabi 2025-26)
The printed total (31,40,04,270) is higher than the sum of the state rows (30,62,01,769)
Each state row as printed, and both totals
Lok Sabha 2753
Uttar Pradesh district rows add up to 2,46,48,335, while the state table in the same reply gives UP as 2,46,28,676 (a difference of 19,659)
Both figures, with a note
These are small differences relative to the totals, but we think readers should know about them. If you are citing a figure in official work, use the original document.
How these numbers are produced
Farmer IDs are counted by the AgriStack systems when a state approves a farmer’s land claim and the ID is generated. The Ministry compiles state-wise counts and publishes them, usually when answering questions in Parliament. For a fuller explanation of what is counted and what is not, read How AgriStack statistics are collected.
What the numbers do not tell you
Coverage percentage. The Government has not published, in the documents we checked, a state-wise count of eligible farmers to compare against. We therefore do not show “percentage registered”.
Quality of records. A generated ID does not tell you whether all of a farmer’s land was linked correctly.
Benefits delivered. The count of IDs is not the count of farmers receiving any scheme.
Non-participating states. States absent from a table may be at an early stage, may use their own systems, or may not have reported.
Our method
We download the official PDF or release and save a copy.
We transcribe each state or district row exactly as printed.
We add up the rows and compare them with the printed total. Any difference is recorded.
Every record in our data file includes the state, metric, value, unit, reporting date, source URL, publishing organisation and the date we last verified it.
When a new official table appears, we add it rather than overwrite older ones, so changes over time stay visible.
If you spot a transcription error, please tell us through the contact page, quoting the source document and row.
According to a Lok Sabha reply dated 11 August 2026, 10,33,93,603 Farmer IDs had been generated across 21 states and union territories as on 6 August 2026. This was the most recent official state-wise table we found when we last checked on 12 October 2026.
Which state has the most Farmer IDs?
+
Uttar Pradesh, with 2,47,59,182 Farmer IDs as on 6 August 2026, about 24% of the national total. Maharashtra (1,36,28,992) and Madhya Pradesh (1,14,44,193) were next.
Why are some states missing from the table?
+
The official tables list only states and union territories where Farmer IDs had been generated. Some states had not started or had not reported. A missing state does not mean the state has no farmers or no plans.
Does the number of Farmer IDs equal the number of farmers?
+
No. It is the number of IDs generated so far. It does not show how many eligible farmers are still to register, and states differ in when they started and how many landholders they have.
How often is this page updated?
+
We update it when the Government publishes a new official table, usually in replies to Parliament questions or PIB releases. The date each figure refers to is shown next to it.
Can I download the data?
+
The underlying data file is published with this site's source code as statistics.json, with the source URL and reporting date for every record. You can also check each figure against the linked official PDF.
Official references and sources
Facts on this page were last checked against these sources on 12 October 2026.
The Digital Crop Survey explained: who records your crop, how geo-tagged photos work, official 2025-26 coverage, why it matters for MSP, insurance and relief.
Registering for a Farmer ID at a Common Service Centre: what to bring, how the visit works, whether you should pay, and how to protect your Aadhaar and OTP.